Unify Qualitative Coding, Quantitative Visualization, and AI Insights
FableSense AI is the first platform built for researchers who work with both qualitative and quantitative data. Code interviews, analyze surveys, and discover insights - all in one place.
Trusted by researchers at top universities and UX teams
Click to play with sound
Everything You Need for Mixed-Methods Research
Seamlessly integrate qualitative and quantitative data analysis in one powerful platform
Qualitative Coding
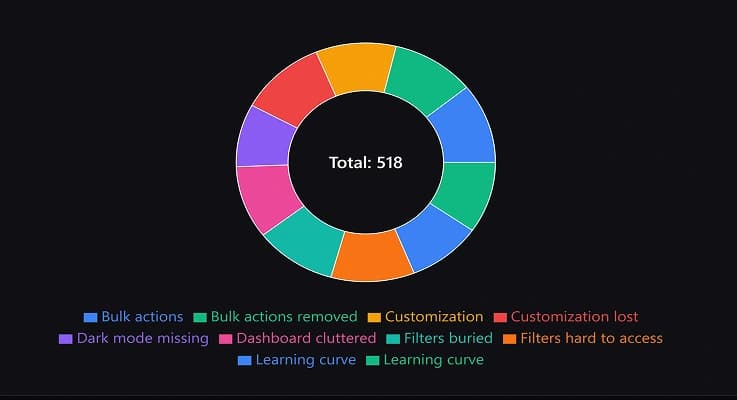
Code interviews, transcripts, and open-ended responses with an intuitive workspace. Create codes, tag segments, and build codebooks
Quantitative Visualization
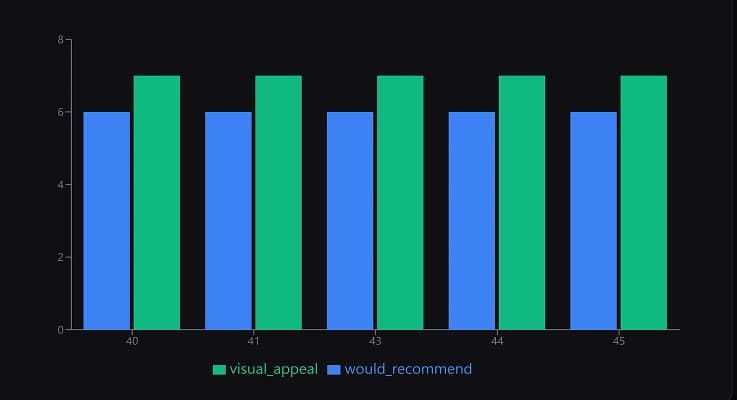
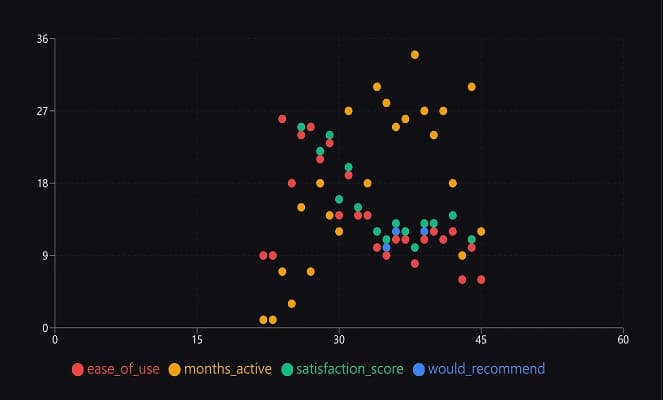
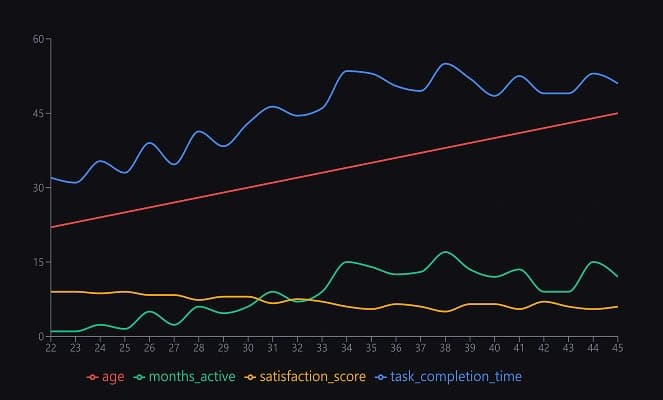
Upload CSV/Excel files and create beautiful charts. Scatter plots, histograms, box plots, and advanced statistical visualizations
AI-Powered Insights
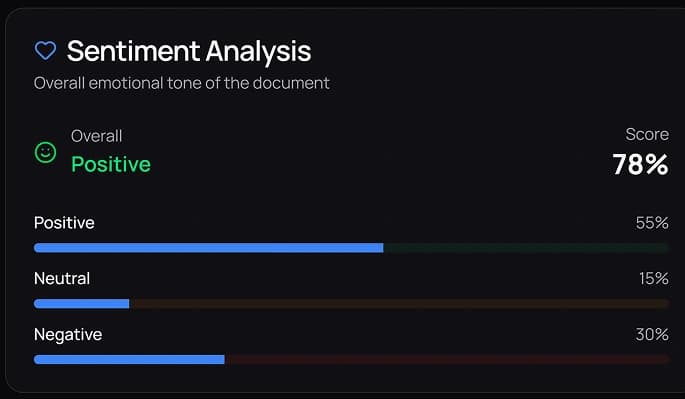
Get automatic theme detection, sentiment analysis, and pattern recognition across your qualitative and quantitative data
Joint Displays
Create integration matrices, side-by-side comparisons, and network diagrams that merge qualitative themes with quantitative variables
Advanced Correlations
Discover relationships between coded themes and survey variables. Heatmaps, network diagrams, and geographic overlays
Share & Collaborate
Share visualizations and coded documents with public links. Perfect for research presentations and stakeholder reports
( 01 ) Create Project
( 02 ) Upload Data
( 03 ) Visualize and Coding
( 04 ) Discover Connections
Why Teams Switch to FableSense AI
See how we compare to traditional QDAS software — at a fraction of the cost
Your Research Data is Safe
We take data privacy seriously — your work stays private, protected, and under your control
Your Data Stays Yours
Your research data is never used to train AI models or shared with third parties. Period.
Encrypted & Secure
End-to-end encryption protects your data in transit and at rest across all projects.
Full Data Control
Export or permanently delete all your data at any time. No lock-in, no hidden retention.
Research Compliant
Built with GDPR, FERPA, and IRB compliance in mind so your research meets institutional standards.
Simple, Transparent Pricing
Start free and upgrade as your research grows. No hidden fees.
Free
For individuals getting started with mixed-methods research
- 1 Project
- 5 Documents
- 50 Coded Segments
- 3 Datasets (5K rows max)
- 1 Dashboard
- 2 Correlations
- 5 Visualizations (per dataset)
- 2 Joint Displays
- 3 Shared Analyses
- 5 AI Analyses/month
- 2 Transcriptions/month
- 2 Kappa Reports/month
- 1 Collaborator
- 100 MB Storage
Researcher
For individual academic researchers and indie UX researchers
- Unlimited Projects
- Unlimited Documents
- Unlimited Coded Segments
- Unlimited Datasets (50K rows max)
- Unlimited Visualizations
- 10 Joint Displays
- 20 AI Analyses/month
- 10 Transcriptions/month
- 10 Kappa Reports/month
- 3 Collaborators
- 5 GB Storage
- Email Support
Learn & Get Inspired
Tutorials, case studies, and best practices for mixed-methods research
Video Tutorials

Fintech Onboarding Friction: Why Users Drop Off & How to Fix It | UX Case Study
A complete break down of why fintech apps lose users during onboarding and how data-driven UX decisions can dramatically improve signup completion rates.
View Case Study
Patient Discharge Experience: Using Data to Improve Healthcare Outcomes
Delve into the patient discharge process and learn how to use data analytics to identify pain points, optimize communication, and enhance the overall experience for patients transitioning from hospital to home care.
View Case Study
E-Commerce Checkout Drop-Offs: Analyzing User Behavior & Optimizing Conversions
Explore the common reasons behind e-commerce checkout abandonment and learn how to use qualitative and quantitative data to optimize the user experience and boost conversion rates.
View Case StudyChurn Analysis for Mobile Apps: Using AI to Uncover Hidden Patterns in User Behavior
Learn how to leverage AI to analyze user behavior and identify key factors contributing to churn in mobile apps, enabling you to implement targeted strategies for retention and growth.
View Case StudyTeacher Burnout in EdTech: Create Supportive Solutions for Educators
Explore the critical issue of teacher burnout in the EdTech industry and discover how to utilize data-driven insights to design supportive solutions that enhance educator well-being and effectiveness.
View Case StudySaaS Prioritization: How to Use Data to Decide What Features to Build Next
Discover how to leverage user data and feedback to prioritize feature development in SaaS products, ensuring that you build the right features that drive user engagement and business growth.
View Case Study